


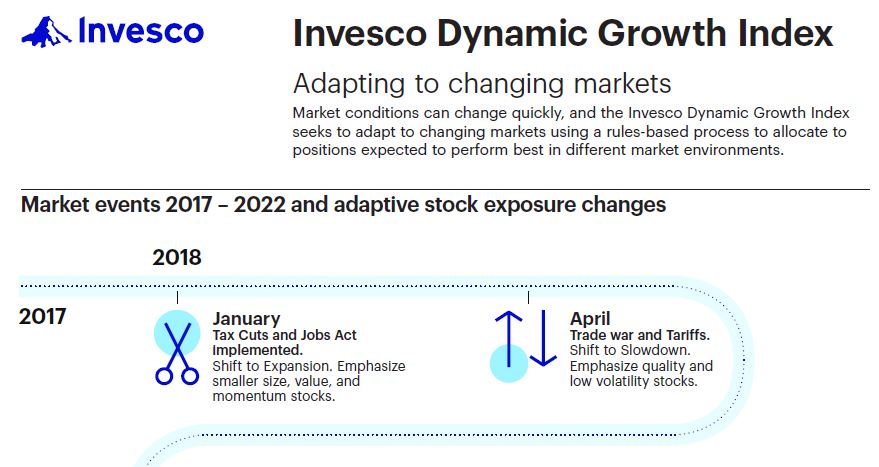
About Invesco Dynamic Growth Index
Stock market exposure built from a dynamic multi-factor approach. Bond exposure that responds to changes in market conditions. Daily, adaptive allocations seek to mitigate wild swings in the market. All delivered in a single, comprehensive package.
How it works
Dynamic Multi-Factor
Dynamic multi-factor strategy seeks to take advantage of changing market environments using a disciplined approach to determine the current economic regime and then increase exposure to factors that tend to be rewarded in that climate while decreasing exposure to those that do not, in order to seek to deliver better returns than generic stock market exposure:
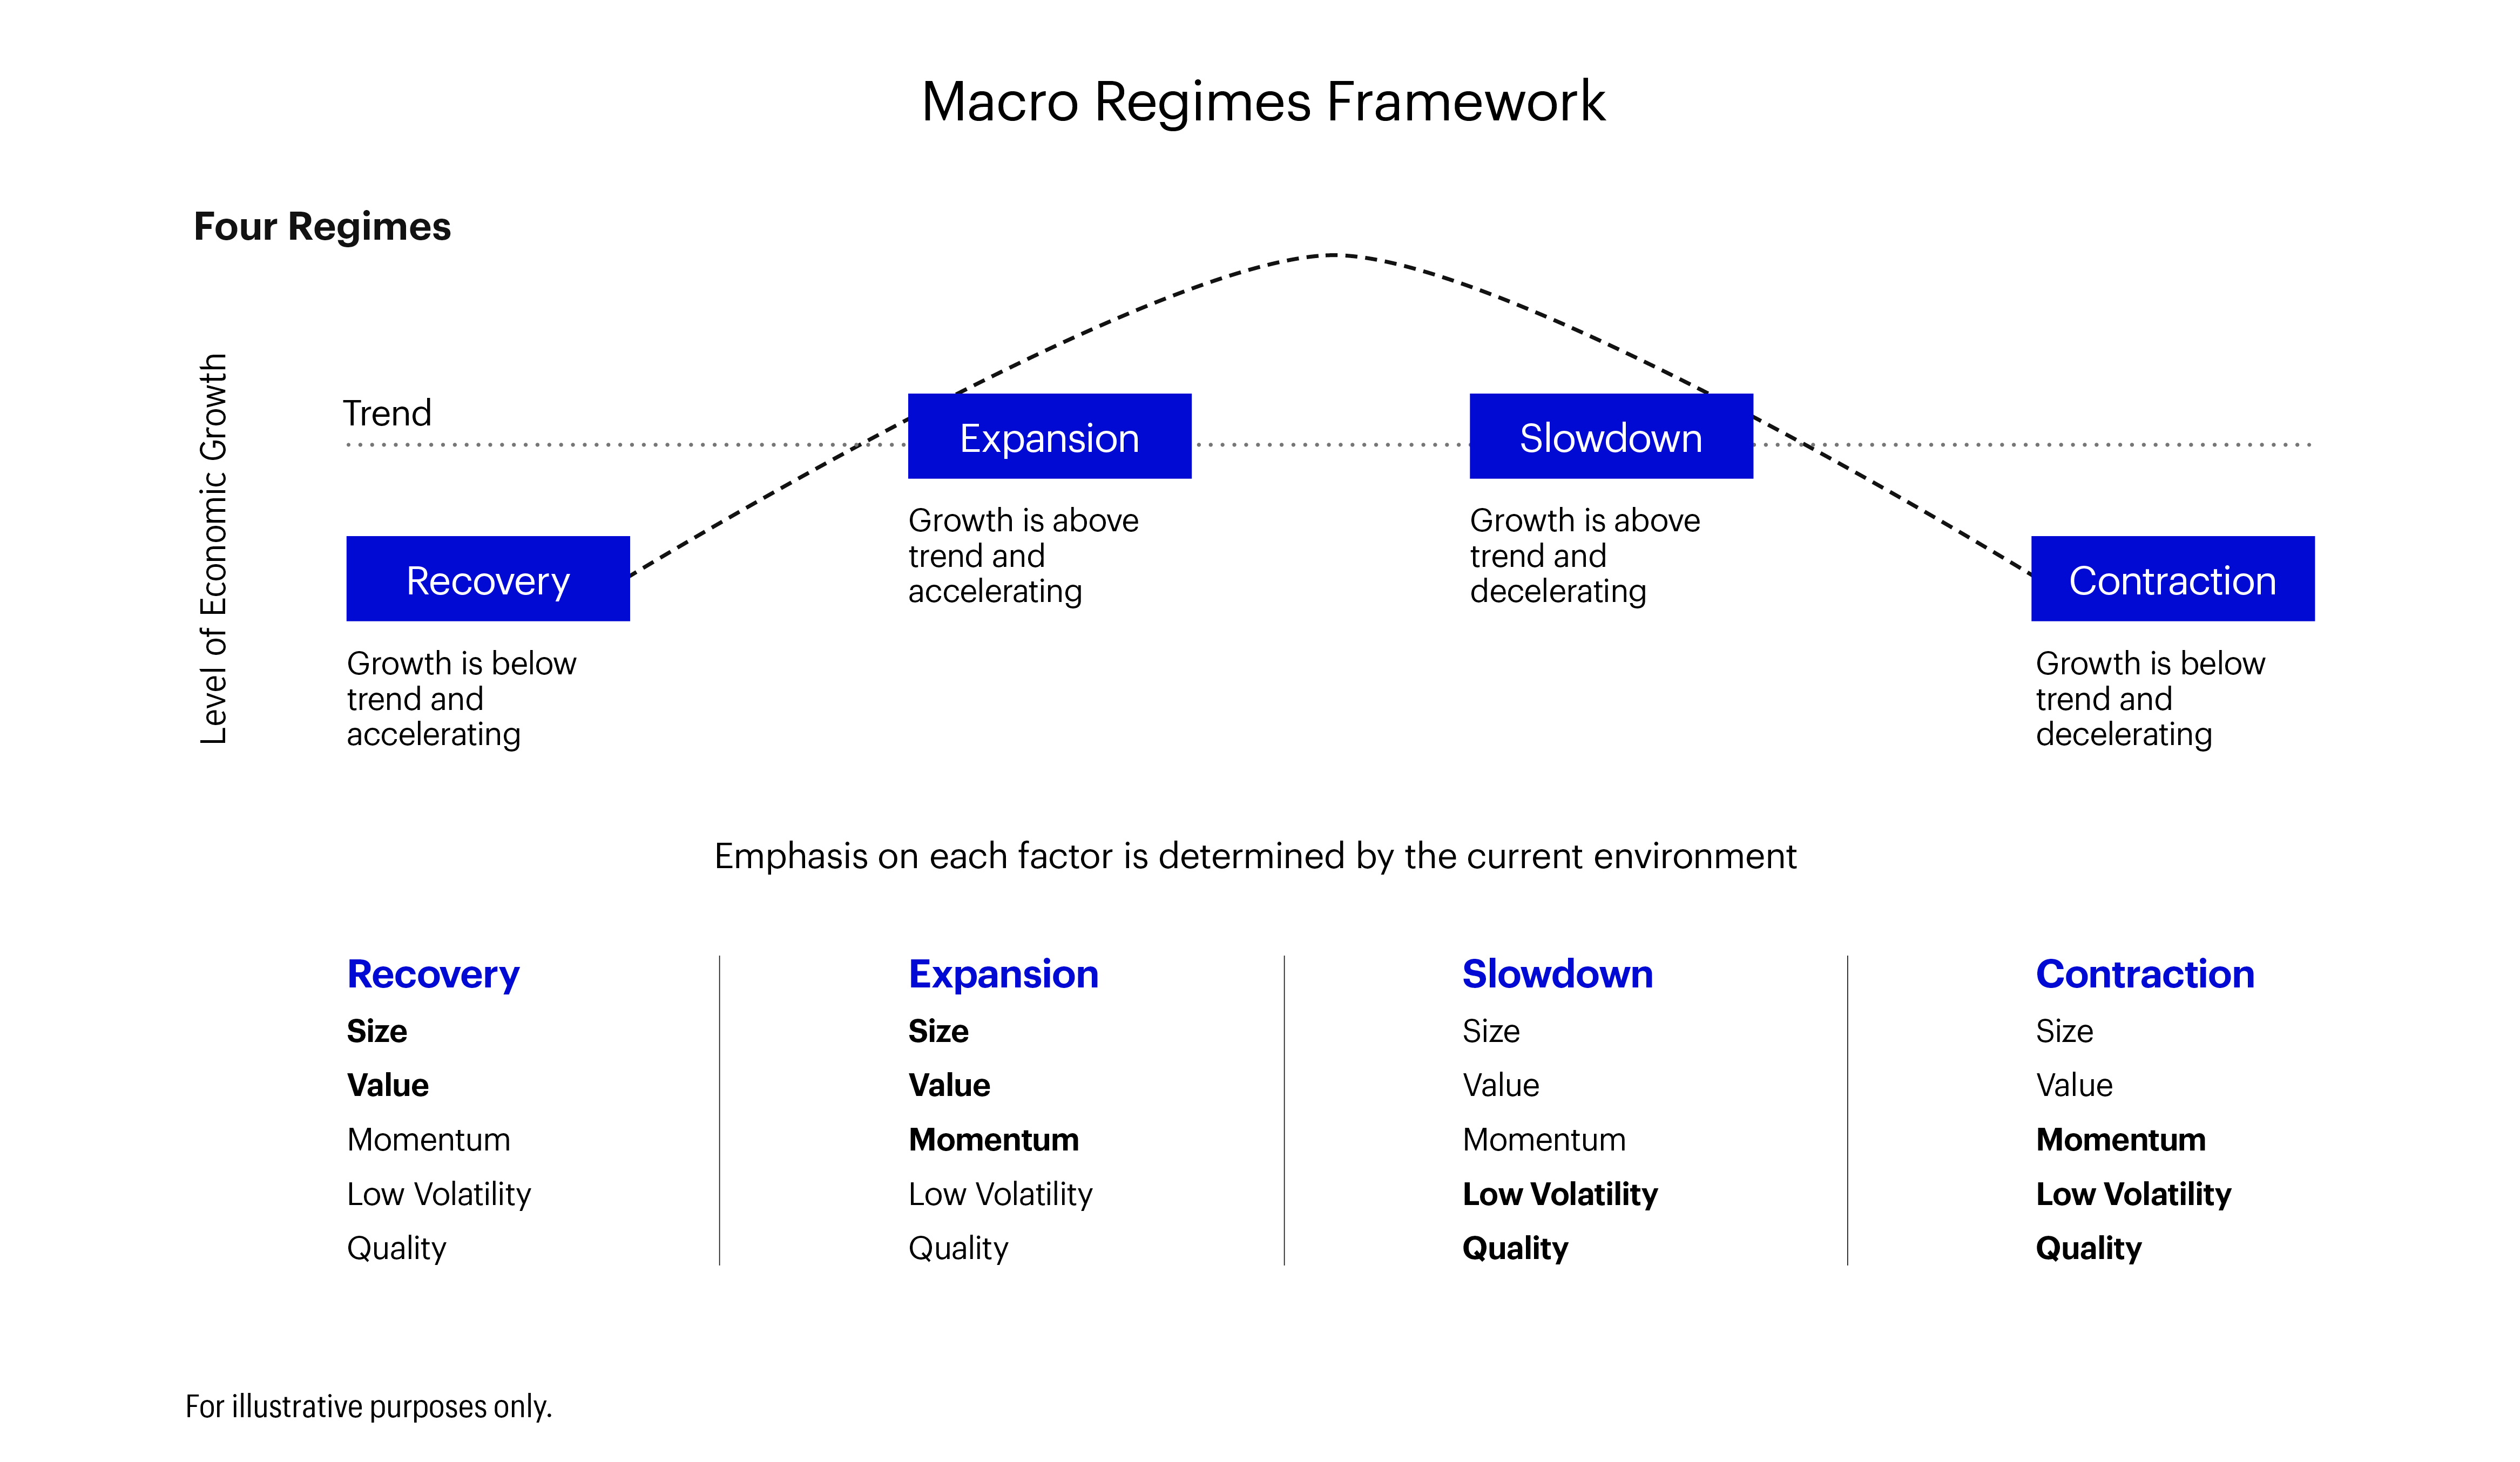
Uses a rules-based approach that assigns securities a score for each investment style: Value, Momentum, Quality, Low Volatility and Size. Security weights are then tilted in a rules-based manner based on the factors most relevant to the current economic regime.
Responsive Bond Exposure
In addition to multi-factor equity, the Invesco Dynamic Growth Index also provides exposure to bonds when conditions warrant as an additional and complementary source of returns. Beneficially, bonds – and, in particular, US Treasury bonds – quite often experience less dramatic swings in returns relative to stocks.1
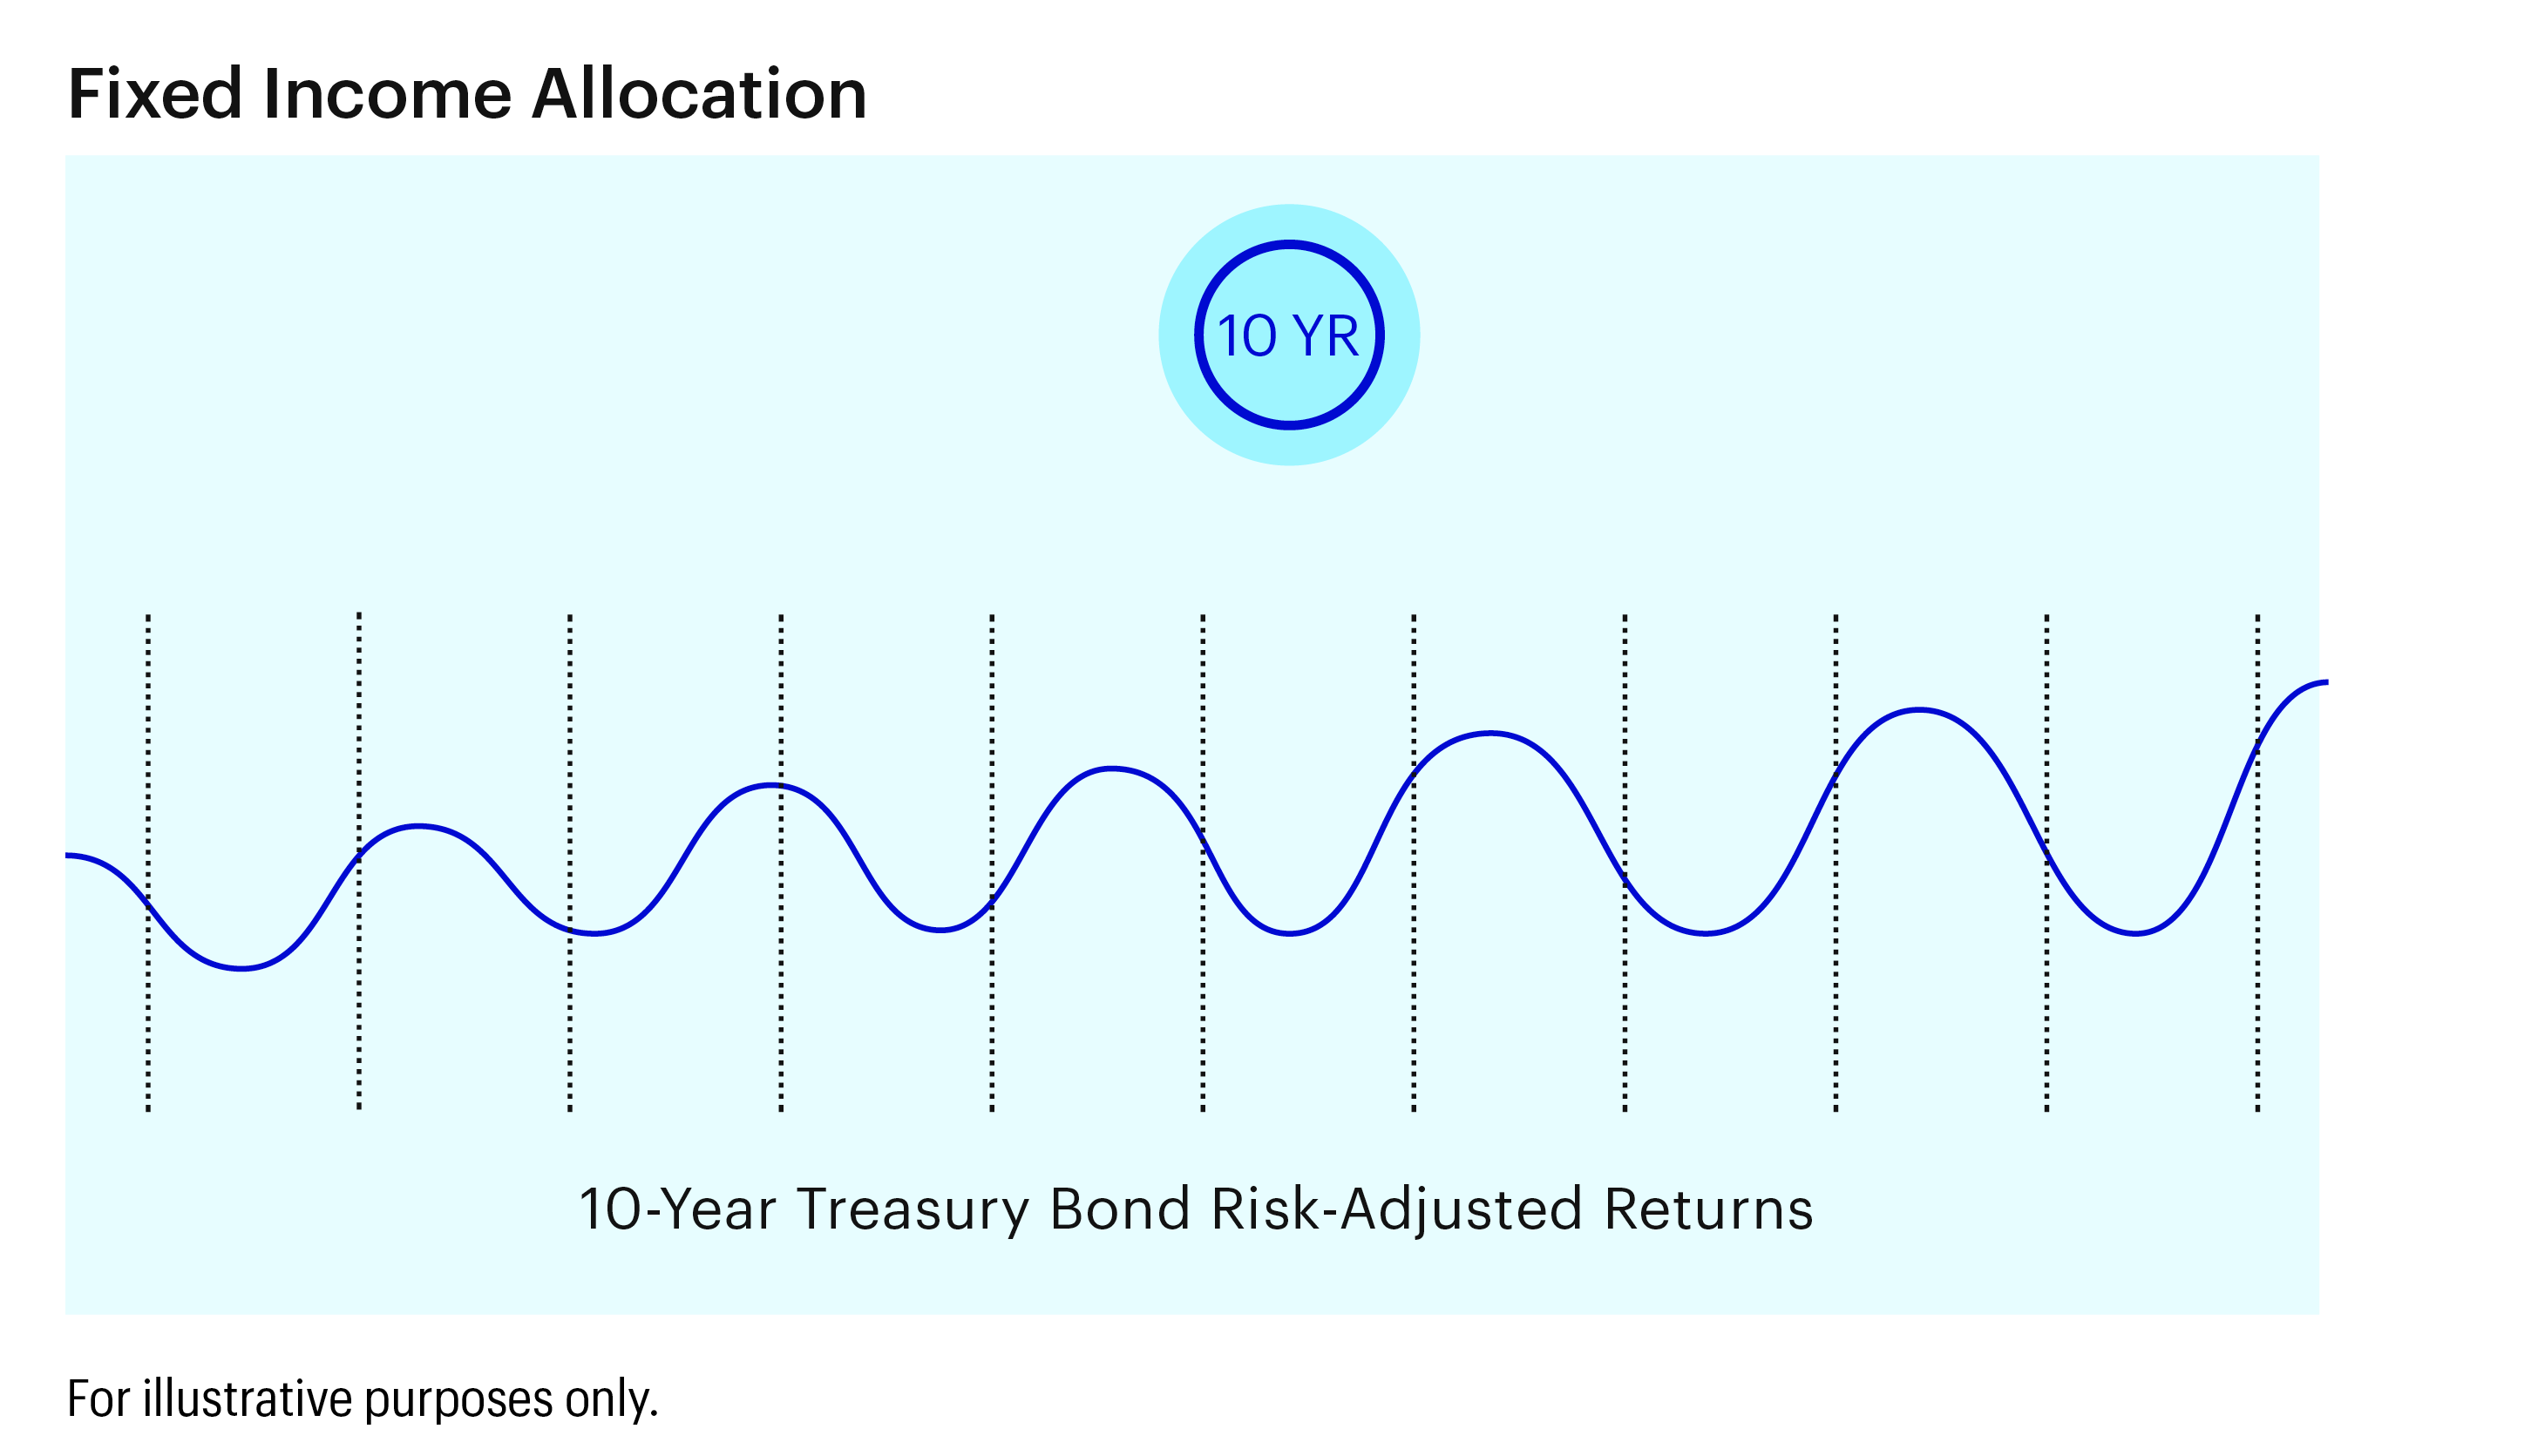
In most market environments, bond exposure in the Index comes from exposure to 10-year Treasury bonds, which, historically, have delivered stronger returns than cash.2

However, a drop in price coupled with higher volatility in 10-year Treasuries often signals a rise in interest rates. When this happens, the Index allocates a portion of the bond exposure away from 10-year Treasuries and into cash, potentially offering more price stability under these conditions. The goal is to provide more defensive exposure and help cushion the impact of declining bond prices.
Adaptive Asset Allocation
Exposure to stocks, bonds, and cash are adjusted daily seeking to deliver a smoother performance profile for the Invesco Dynamic Growth Index over time.

For instance, when the riskiness of stock holdings rises, the Index will shift away from stocks and into bonds, into cash or into a combination of bonds and cash.
On the other hand, as the riskiness of stock holdings decreases, the Index will shift away from bonds or cash and into stocks.
Additionally, as the riskiness of the combined allocation of stocks and bonds rises and falls, the Index allocates more and less, respectively, to cash.
In periods of high volatility, it may be possible for the index to be comprised heavily or fully of bonds and / or cash, which may persist as volatility is elevated. Due to excess return index construction, cash allocations in the index are non-remunerated.
Why Factors Work
The centerpiece of the Invesco Dynamic Growth Index is a dynamic multi-factor approach. Value, Momentum, Quality, Low Volatility and Size are stock characteristics, or factors, shown by academics and practitioners to deliver more attractive returns historically than the broad market:3

Value
Investment Rationale:
Attractively priced stocks tend to outperform those that are expensive
Factor Metrics: Cash flow, earnings and sales multiples

Momentum
Investment Rationale:
Trends in recent company stock performance tend to continue
Factor Metrics:
Recent stock performance

Quality
Investment Rationale:
Well-run companies in a position of financial strength tend to be rewarded
Factor Metrics:
Profitability, leverage ratio

Low Volatility
Investment Rationale:
Investor biases often lead them to overpay for attention-grabbing stocks with lottery-like payoffs as compared to low-volatility stocks
Factor Metrics:
Recent stock performance

Size
Investment Rationale:
Small companies tend to perform better than larger companies
Factor Metrics:
Market capitalization
Resources


- For the 10-year period December 31, 2011, to December 31, 2021, the annualized volatilities of the S&P 500 Index and Merrill Lynch 10-Year U.S. Treasury Futures Index were 13.1% and 4.2%, respectively. Over the same time period, the correlation between these two indexes was -32.6%. Correlation is a statistic that measures the degree to which two sets of data move in relation to each other. A correlation of +100% means as one set of data moves, either up or down, the other set moves exactly the same, and in the same direction. A correlation of -100% means that the data move in exactly opposite directions.
- For example, the annualized returns from December 31, 2002, to December 31, 2021, for the Merrill Lynch 10-Year U.S. Treasury Futures Index and Federal Funds Effective Rate Index are 3.51% and 0.90%, respectively
- Sloan, R. 1996. Do stock prices fully reflect information in accruals and cash flows about future earnings? The Accounting Review 71 (July): 289-315. Ikenberry, D., J. Lakonishok, and T. Vermaelen. Market underreaction to open market share repurchases. Journal of Financial Economics 39 (1995): 181-208. Novy-Marx, R. The other side of value: the gross profitability premium. Journal of Financial Economics 108 (2013): 1-28. Narasimhan J., S. Titman. Returns to Buying Winners and Selling Losers: Implications for Stock Market Efficiency. The Journal of Finance Vol. 48, No. 1. (1993): 65-91. Malcolm, B., B. Bradley, and J. Wurgler. Benchmarks as Limits to Arbitrage: Understanding the Low-Volatility Anomaly. Financial Analysts Journal Volume 67 (2011): 1-15. Rosenberg B., K. Reid, and R. Lanstein. Persuasive evidence of market inefficiency. Journal of Portfolio Management 11.3 (1985): 9-16. Basu S. Investment Performance of Common Stocks in Relation to Their Price-Earnings Ratios: A Test of the Efficient Market Hypothesis. Journal of Finance Volume 32, No. 3. (1977) 663-682.
Forward-looking statements are not guarantees of future results. They involve risks, uncertainties and assumptions. There can be no assurance that actual results will not differ materially from expectations. Diversification/Asset allocation cannot eliminate the risk of fluctuating prices and uncertain returns and does not assure a profit or protect against loss. Factor investing is an investment strategy in which securities are chosen based on certain characteristics and attributes that may explain differences in returns. Factor investing represents an alternative and selection index based methodology that seeks to outperform a benchmark or reduce portfolio risk, both in active or passive vehicles. There can be no assurance that performance will be enhanced or risk will be reduced for strategies that seek to provide exposure to certain factors. Exposure to such investment factors may detract from performance in some market environments, perhaps for extended periods. Factor investing may underperform cap-weighted benchmarks and increase portfolio risk. There is no assurance that the index discussed in this material will achieve their investment objectives. Holding cash or cash equivalents may negatively affect performance.
Although bonds generally present less short-term risk and volatility than stocks, the bond market is volatile and investing in bonds involves interest rate risk; as interest rates rise, bond prices usually fall, and vice versa. Bonds also entail issuer and counterparty credit risk, and the risk of default. Additionally, bonds generally involve greater inflation risk than stocks.
This does not constitute a recommendation of any investment strategy or product for a particular investor. Investors should consult a financial professional before making any investment decisions.
Invesco Indexing LLC is an indirect, wholly owned subsidiary of Invesco Ltd. The group is legally, technologically and physically separate from other business units of Invesco, including the various global investment centers. NA2107793